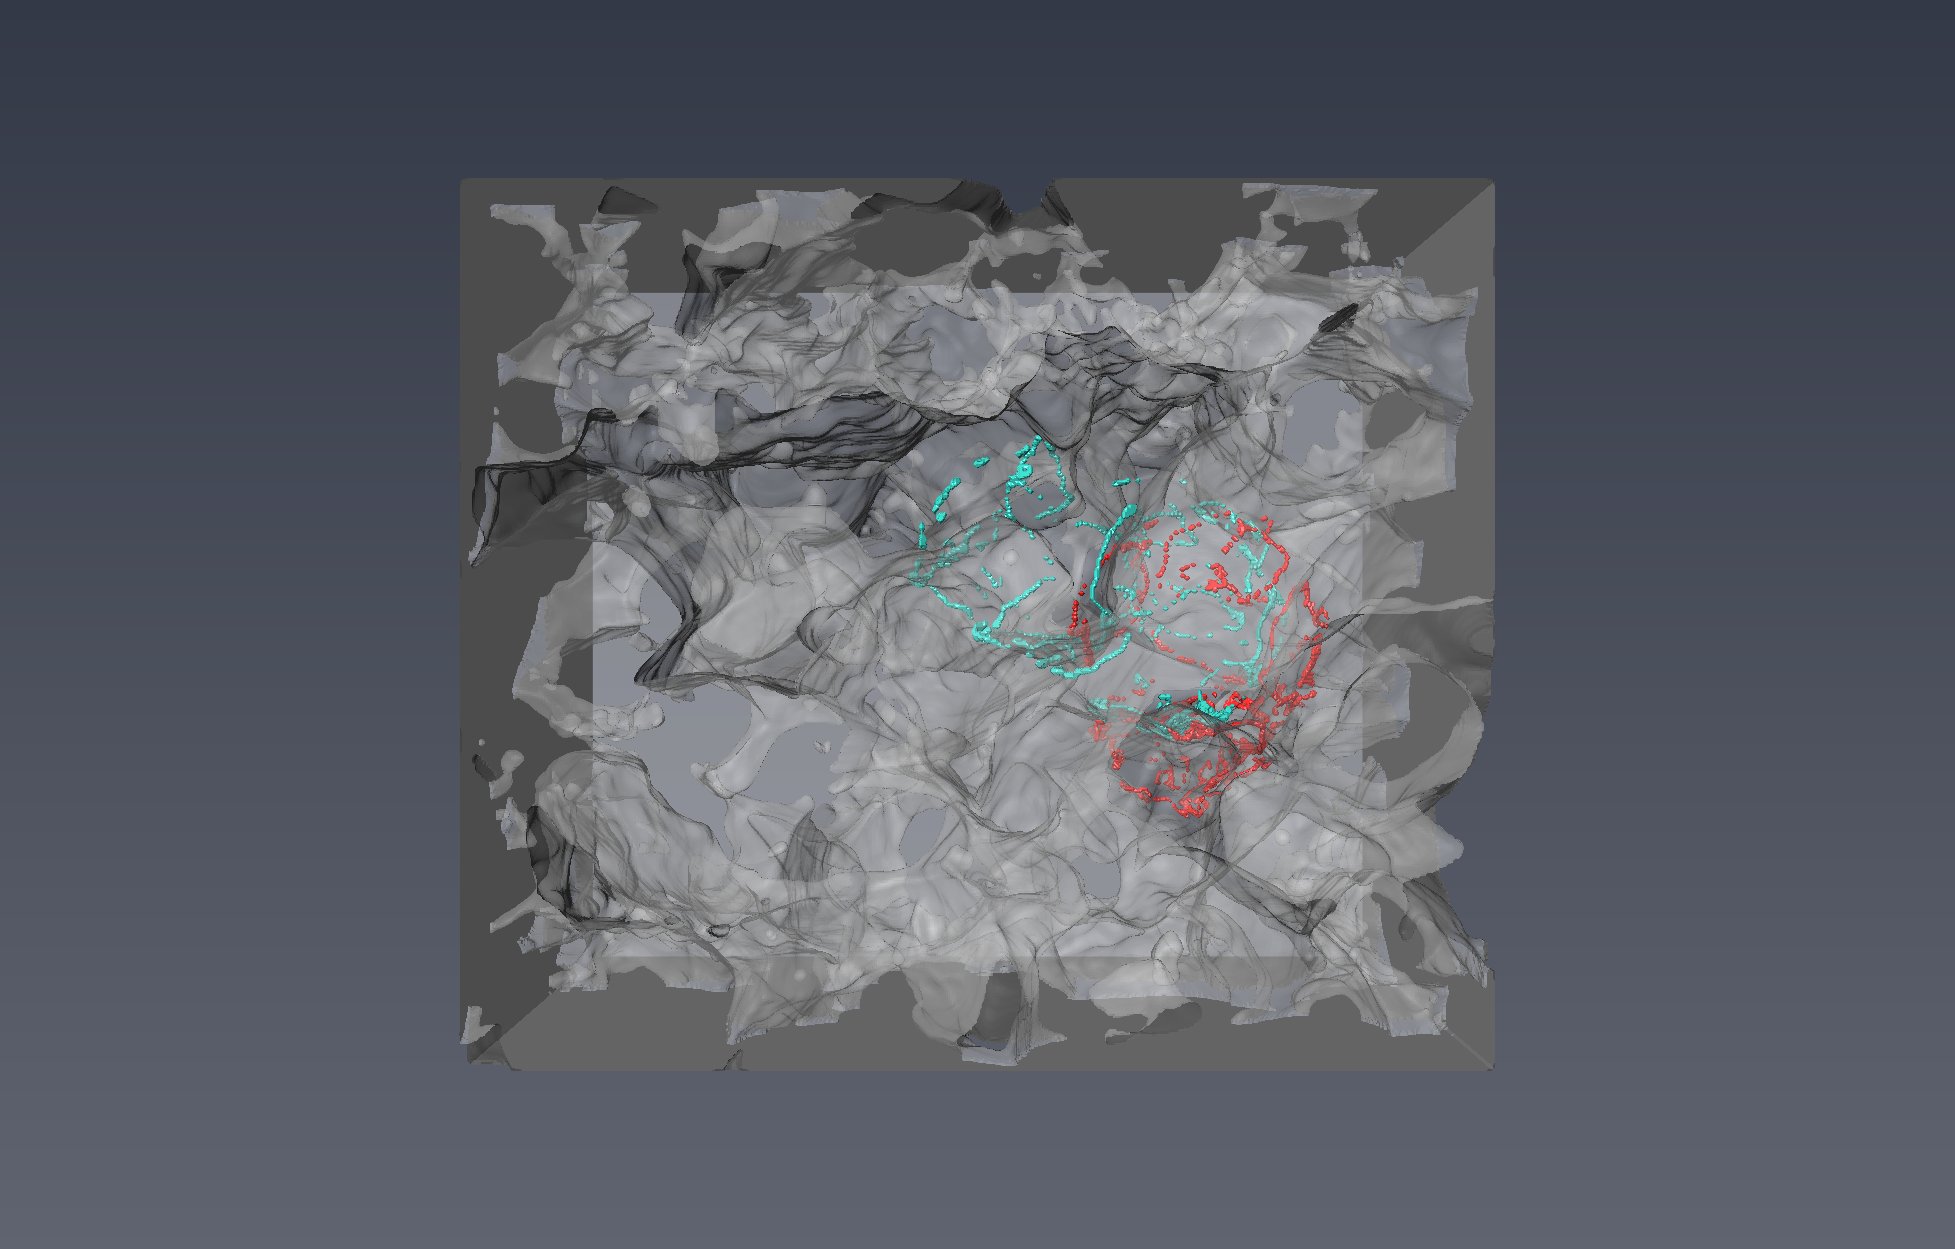
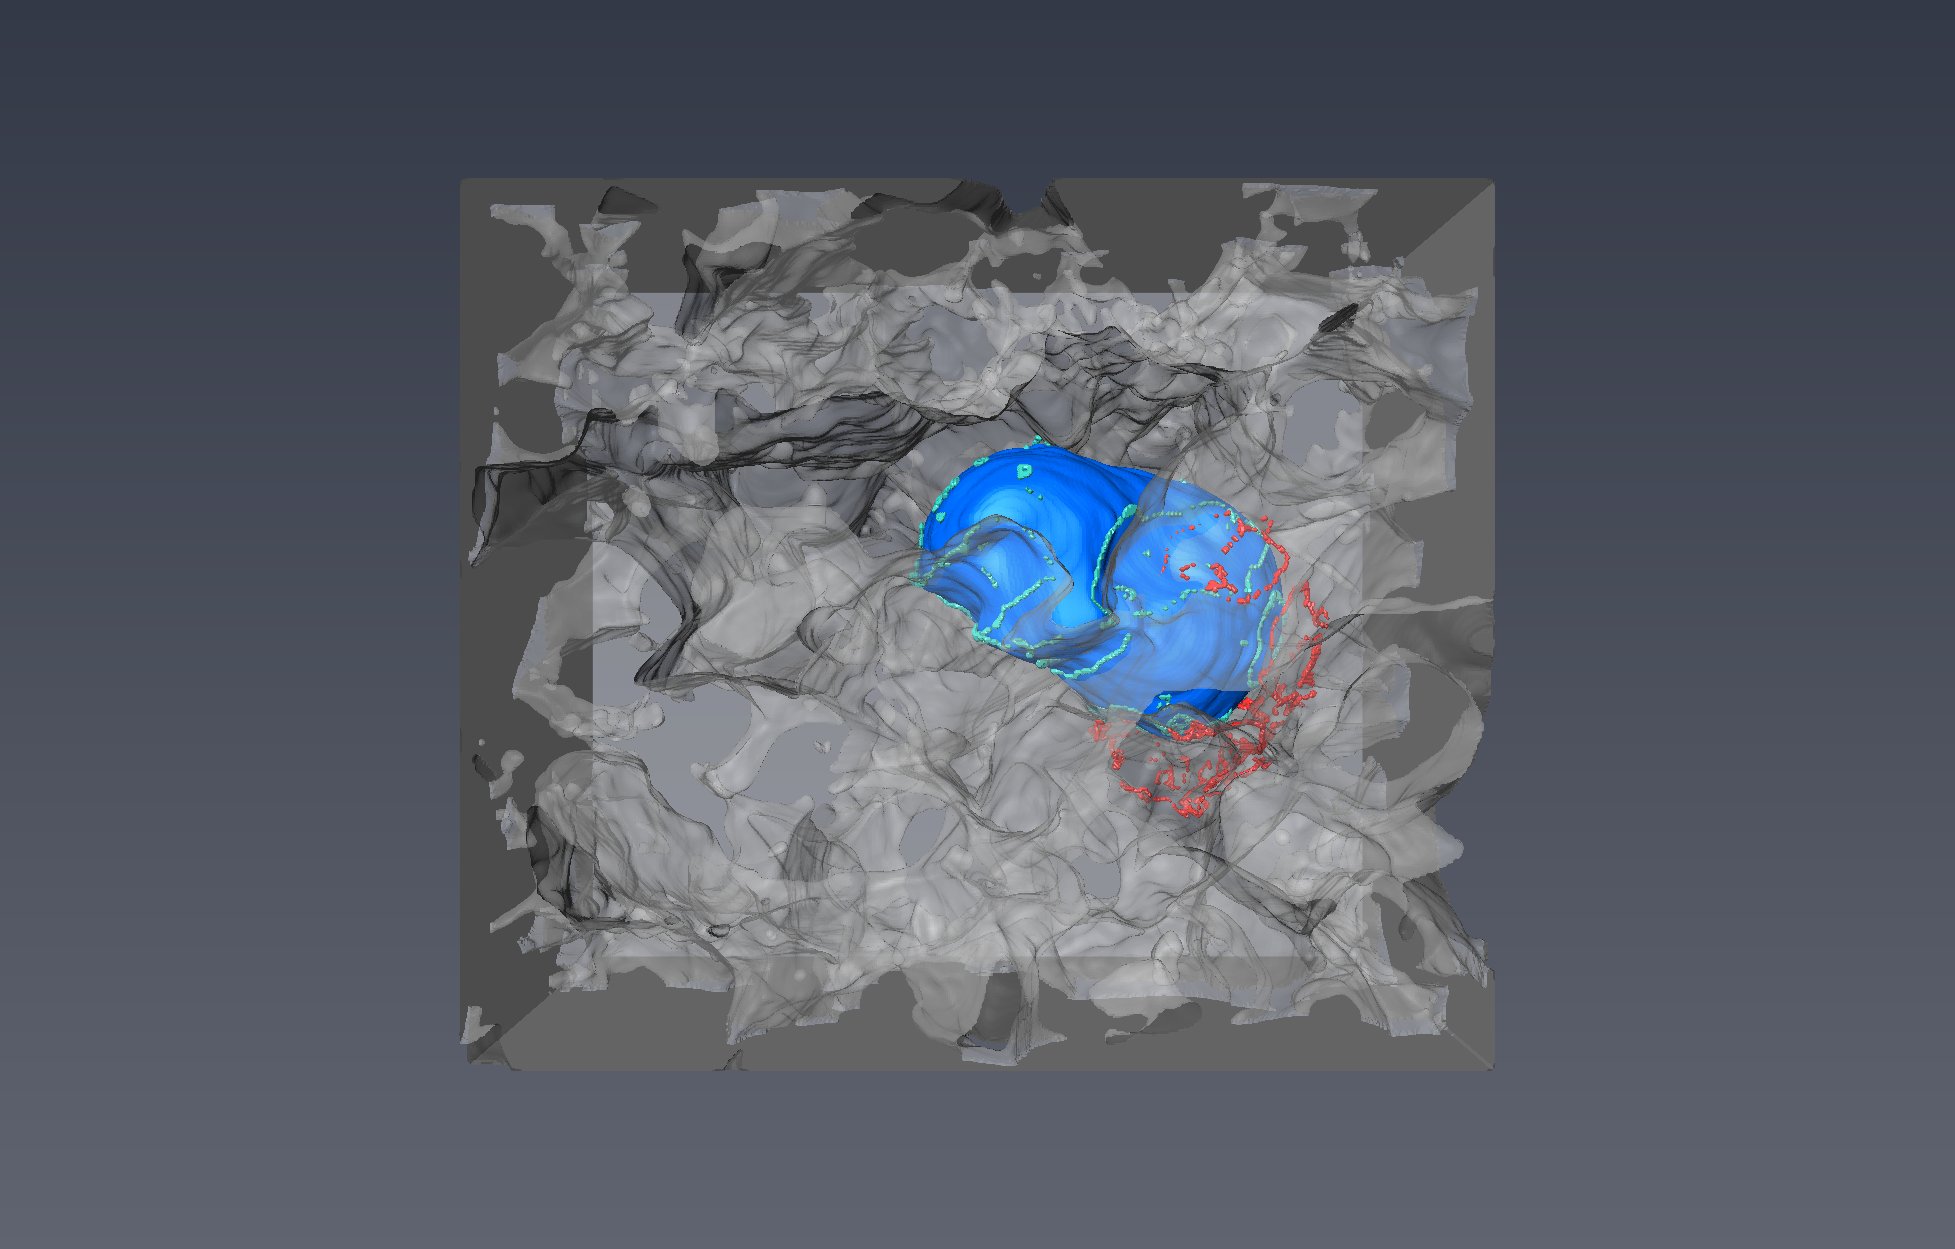
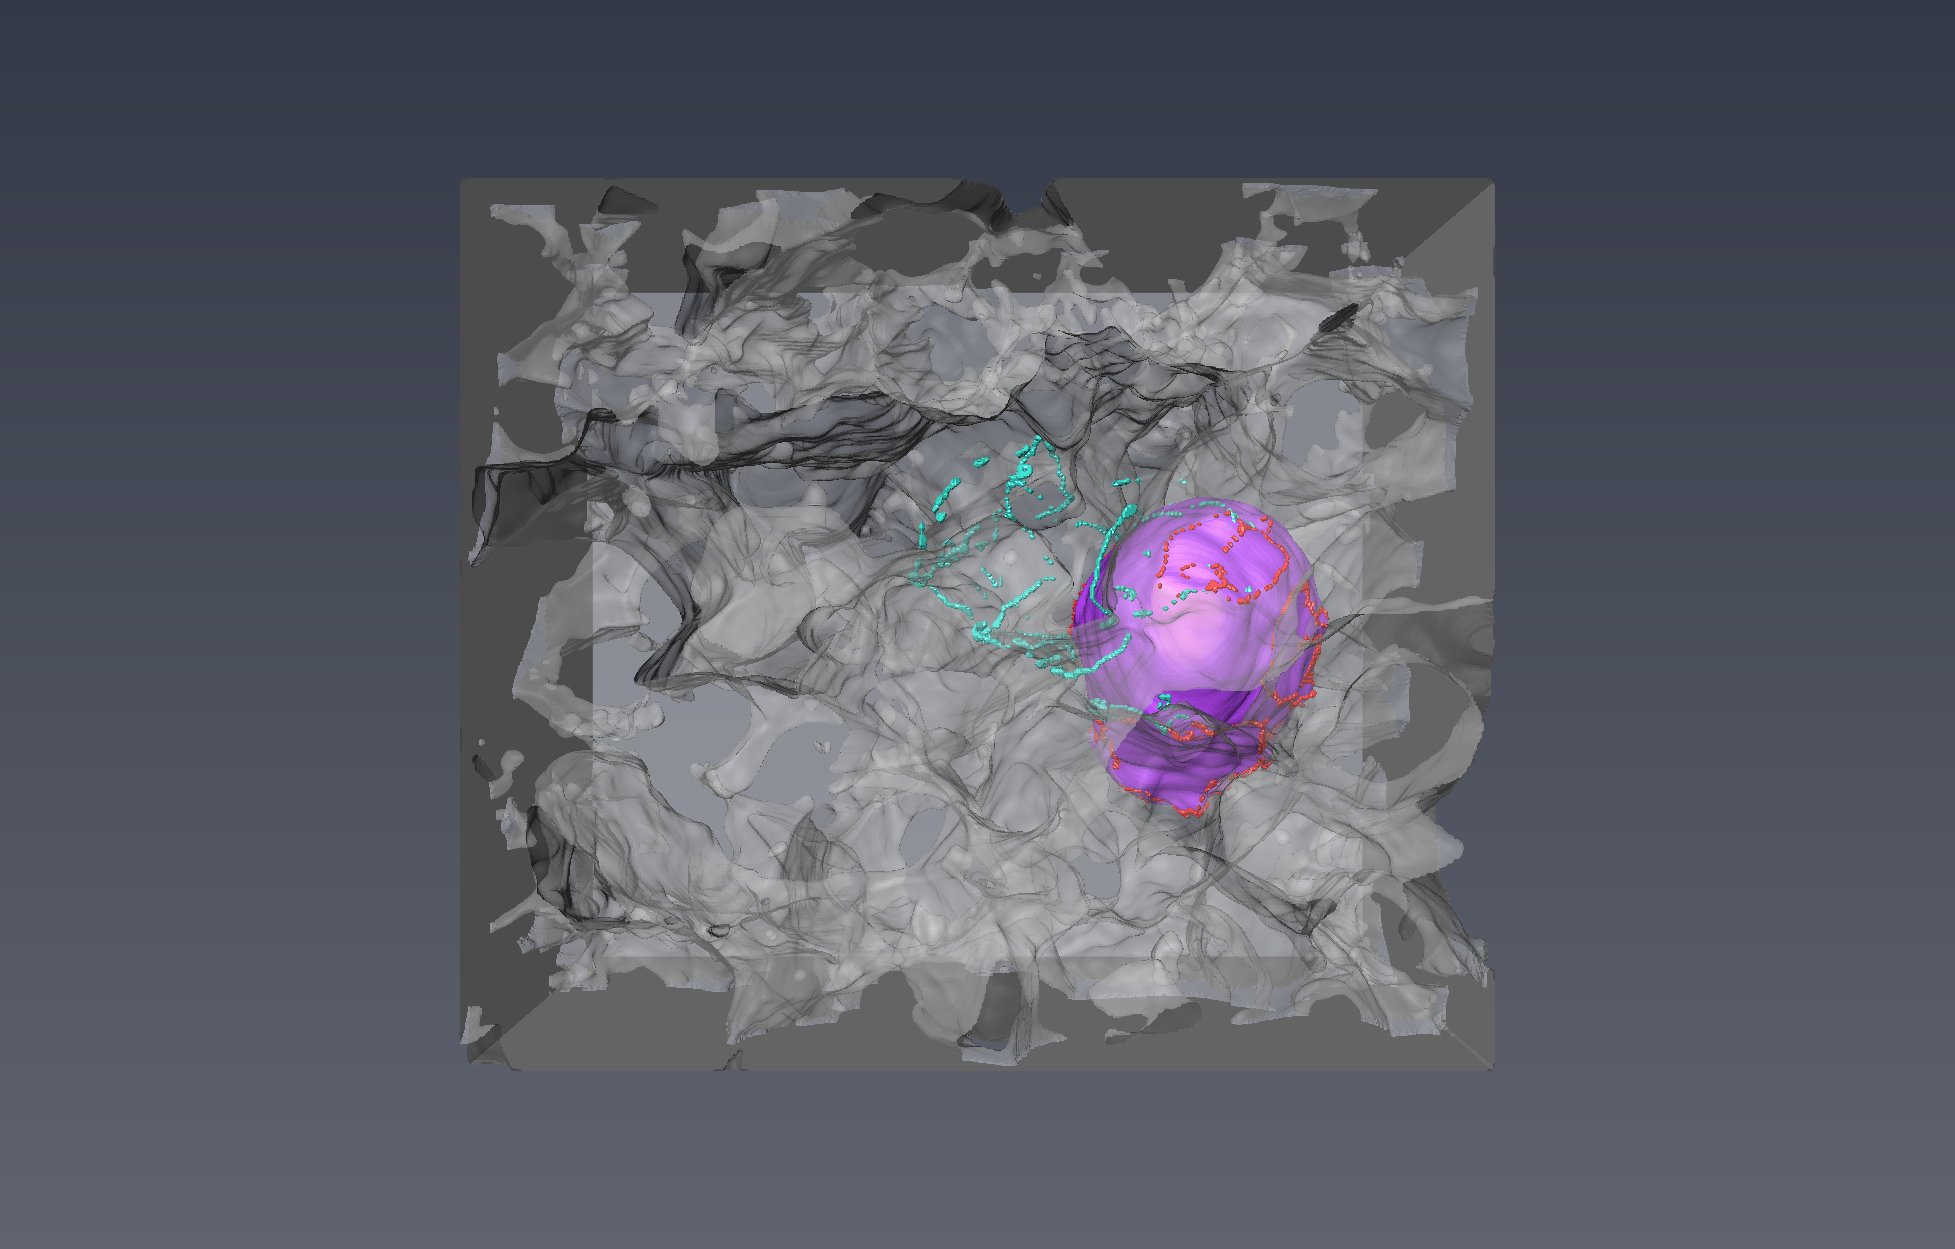
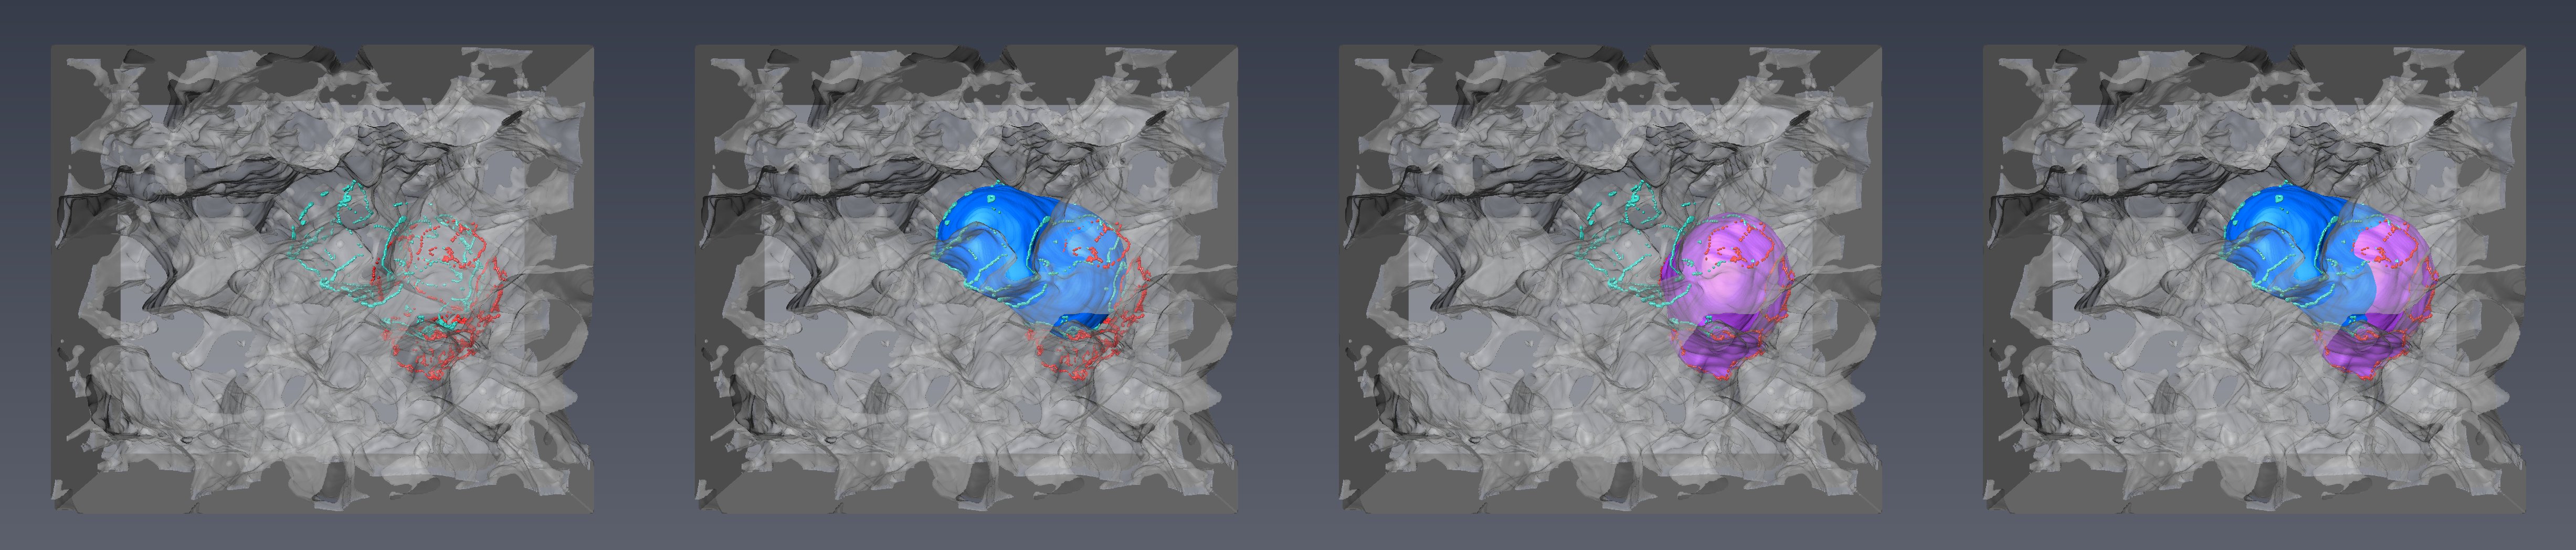
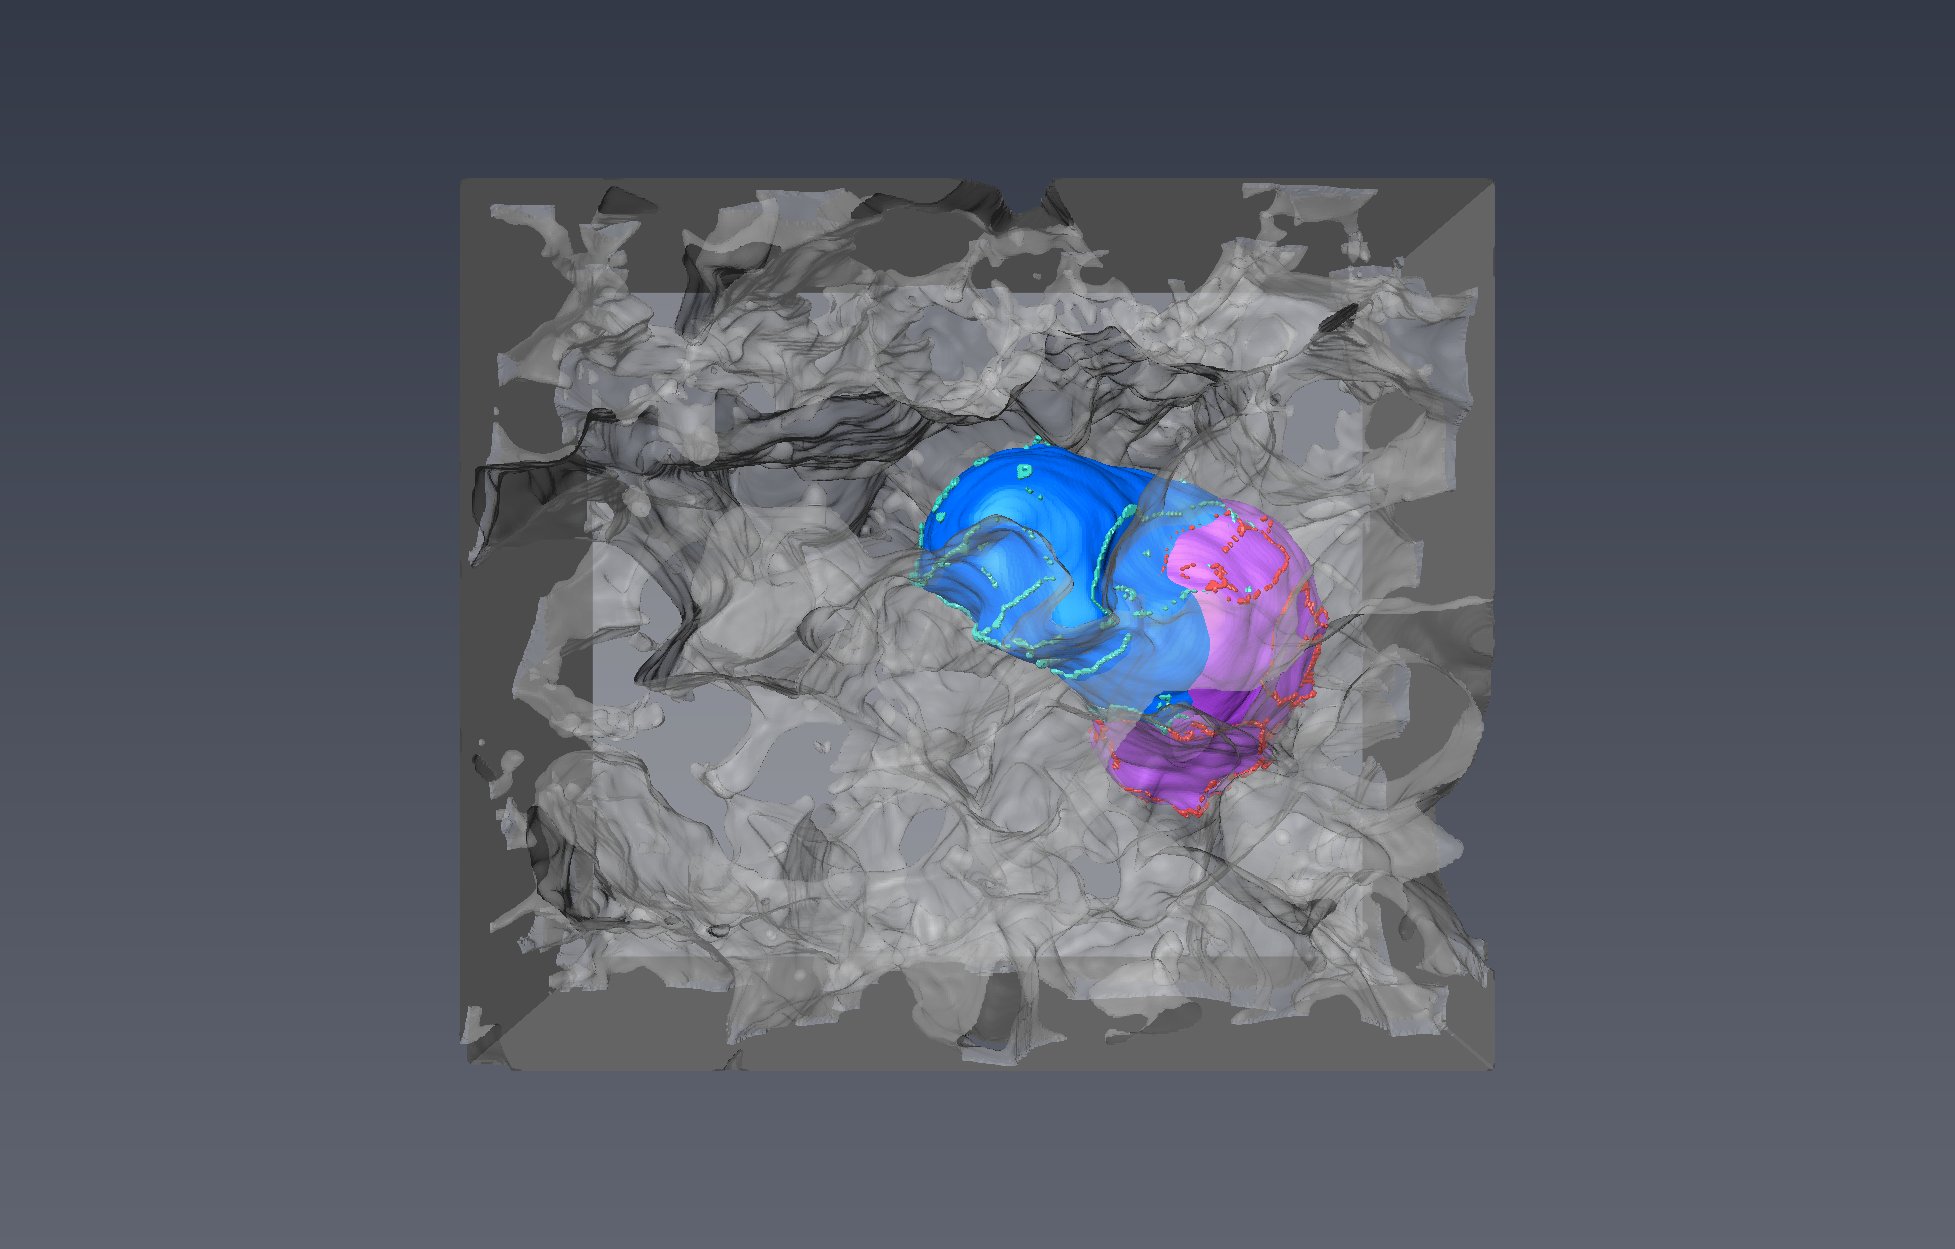
These images were created in PerGeos using the related micro-CT data sets. The opacity of the sandstone rock is reduced to highlight the evolution of the trapped scCO2 ganglion which moves from blue (D-I Cycle 1) to pink (D-I Cycle 2). The contact lines are shown to highlight the change in contact surfaces between D-I cycles.