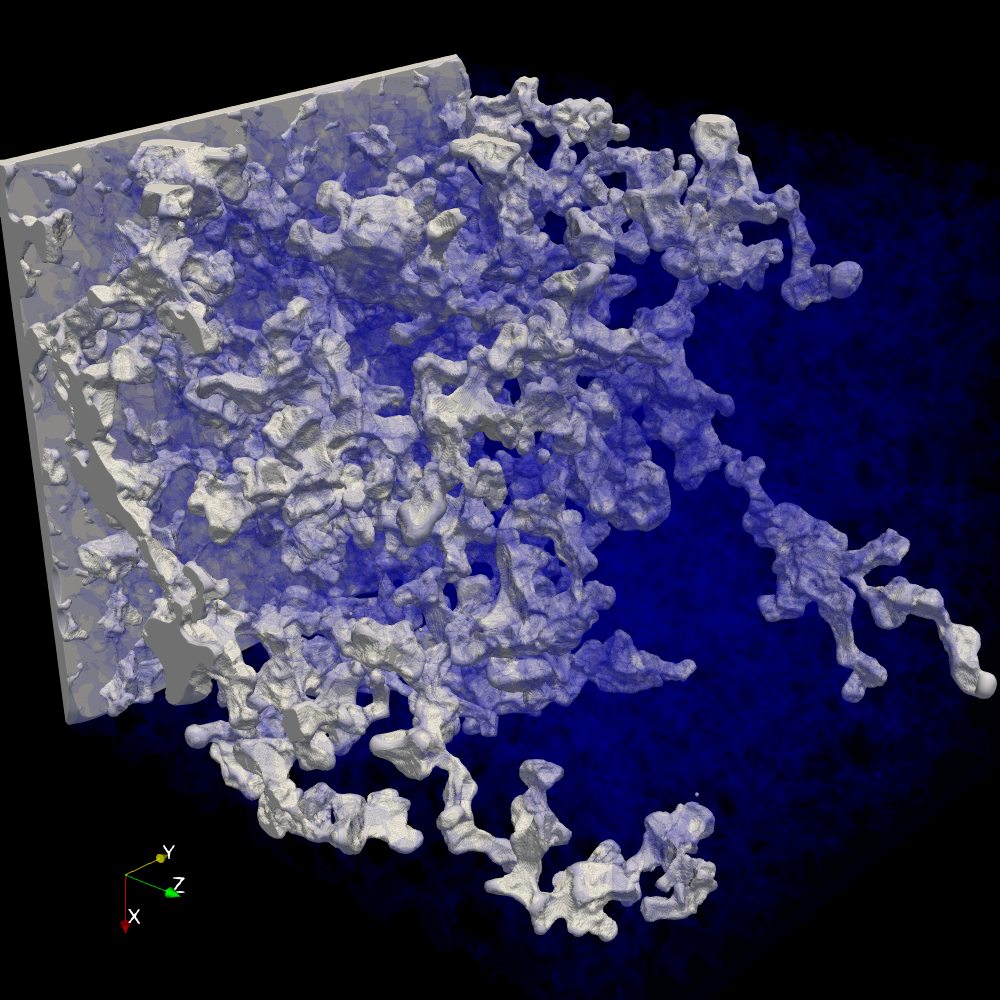
The dataset contains fluid phase distribution obtained from high-resolution drainage simulations in both a heterogenous micromodel and Bentheimer sandstone. The purpose is to investigate the influence of inertial effects on scCO2-brine displacement in complex geometries, where scCO2 is much less viscous than brine or oil meaning that the inertial effects may not be negligible. The direct numerical simulations in this work employ the continuum-surface-force based color-gradient multiple-relaxation-time lattice Boltzmann model combined with a geometrical wetting model. The inertial effects are investigated by varying the Ohnesorge number (Oh) while keeping other conditions the same. A manuscript from this work has been submitted to a journal and is currently in revision. 1). Dataset from Bentheirmer sandstone simulations The geometry of the Bentheimer sandstone is from Herring et al., 2016, where the original data size is 1920*1920*1200 with a voxel resolution of 3.182 micron. A subdomain is cropped from the original data (porosity: 0.19), resulting in a simulation grid of 720*720*900 with a grid resolution of 3.182 micron. The simulation conditions are as follows: case 1: Ca=2.0e-6, Oh=2.23e-3 case 2: Ca=2.0e-6, Oh=5.57e-3 case 3: Ca=2.0e-6, Oh=11.14e-3 contact angle: 30 degree viscosity ratio: 37.7 (nonwetting phase is less viscous) density ratio: 1 Fluid phase distribution data (location and order parameter value) at the breakthrough time from the above three cases are provided. 2). Dataset from micromodel simulations The geometry of the micromodel is from Li et al., 2017, where the original 2D scan is 11275*8460 with a voxel resolution of 0.630 micron. The simulation grid, 1953*13*2640 is constructed from resized 2D scan image (porosity: 0.49), with a grid resolution of 2.727 micron. The simulation conditions are as follows: case 1: Ca=2.6e-5, Oh=2.177e-3 case 2: Ca=2.6e-5, Oh=11.62e-3 contact angle: 10 degree viscosity ratio: 13.2 (nonwetting phase is less viscous) density ratio: 1 Fluid phase distribution data (2D gap-averaged saturation and location on the 2D plane) after one pore-volume injection from the above two cases are provided. The geometry data (solid points location) used in all simulations can be derived from the fluid phase distribution data. 1. Herring, Anna L., Linnéa Andersson, and Dorthe Wildenschild. "Enhancing residual trapping of supercritical CO2 via cyclic injections." Geophysical Research Letters 43, no. 18 (2016): 9677-9685. 2. Li, Yaofa, Farzan Kazemifar, Gianluca Blois, and Kenneth T. Christensen. "Micro‐PIV measurements of multiphase flow of water and liquid CO2 in 2‐D heterogeneous porous micromodels." Water Resources Research 53, no. 7 (2017): 6178-6196.
Yu Chen (Los Alamos National Laboratory)
Oct. 1, 2019
ODC-BY 1.0
10.17612/1fhh-q252
The downloadable archive contains all project data; the size of the archive file for this project is 0.91 GB.
Download