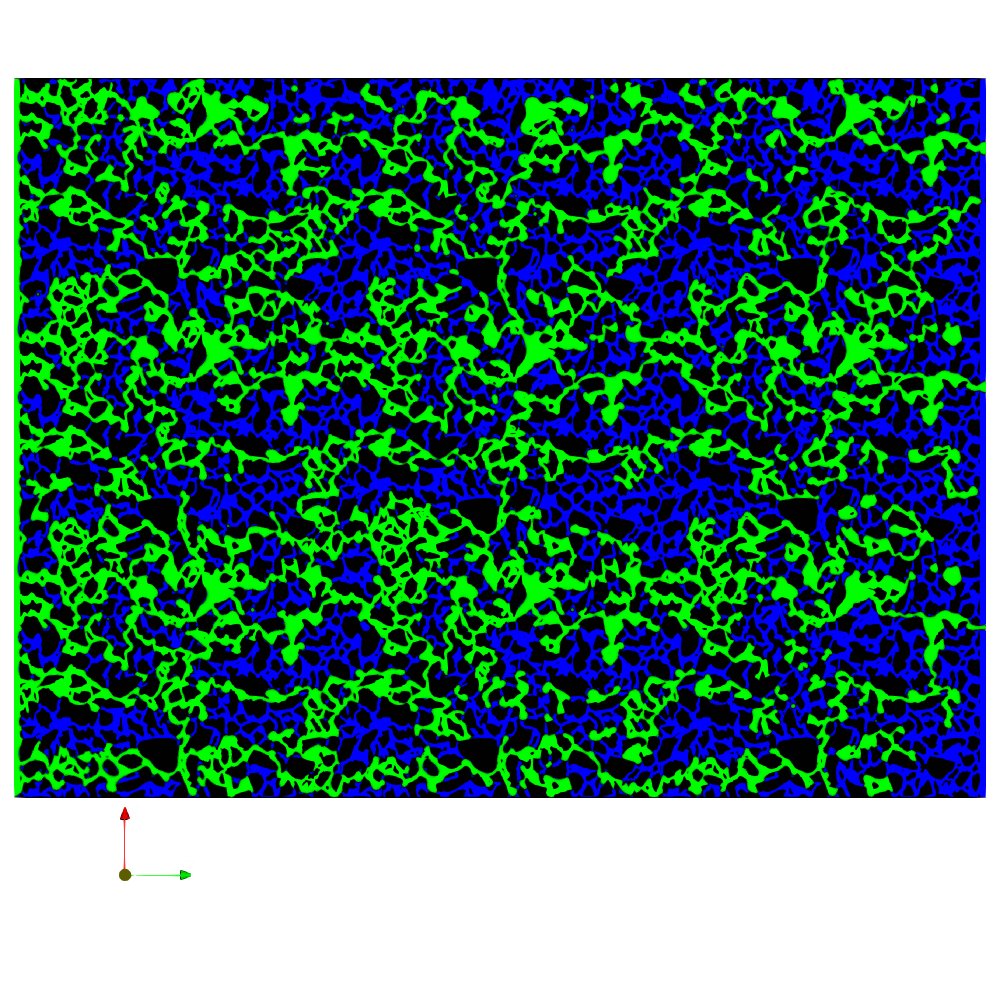
Fluid distribution from simulation case 1: Ca=2.6e-5, Oh=2.177e-3; simulation grid: 1953*13*2640. Data format description: 2D data in ASCII format; the first row shows the total number of fluid points on the present slice; Column 1: coordinate on x-axis; Column 2: coordinate on y-axis; Column 3: value of gap-averaged nonwetting phase saturation (from 0 to 1, where 0 represents wetting phase and 1 represents nonwetting phase).